Here’s What a Foot of Snow Looks Like in Danbury
With all the weather forecasts calling for a foot of snow this weekend, I figured it would be fun to see just what a foot of snow actually looks like.
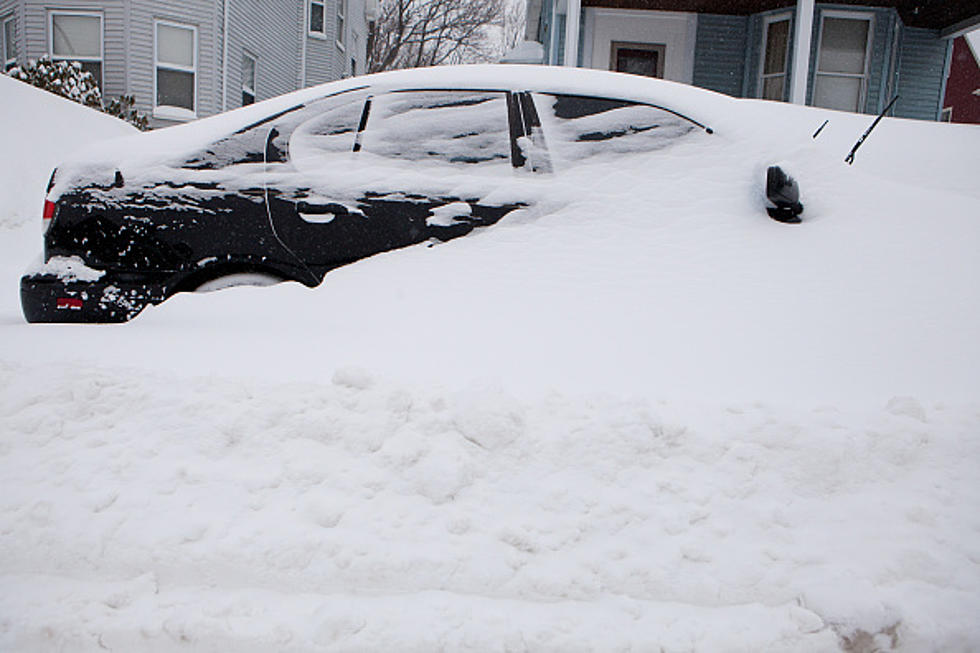
It was near the end of 2020 and the Danbury area got hit with a little over a foot of snow. It was one of the biggest snow events we had in quite a few years and when it was over, a number of our listeners sent in their snow photos for all to see.

Get our free mobile app
There are actually two things you can count on when you get that much snow, a lot of white stuff, and people taking pictures of the snow at their place so they can show you just how much snow there was.
So just what does a foot of snow look like? For those who don't really remember, here's a little refresher.
Photo's Of What A Foot Of Snow Looks Like In Danbury
10 of the Best Places To Go Sledding In The Danbury Area
LOOK: See how much gasoline cost the year you started driving
To find out more about how has the price of gas changed throughout the years, Stacker ran the numbers on the cost of a gallon of gasoline for each of the last 84 years. Using data from the Bureau of Labor Statistics (released in April 2020), we analyzed the average price for a gallon of unleaded regular gasoline from 1976 to 2020 along with the Consumer Price Index (CPI) for unleaded regular gasoline from 1937 to 1976, including the absolute and inflation-adjusted prices for each year.
Read on to explore the cost of gas over time and rediscover just how much a gallon was when you first started driving.
LOOK: Food history from the year you were born
From product innovations to major recalls, Stacker researched what happened in food history every year since 1921, according to news and government sources.
More From WRKI and WINE


